
Tableau certification practice
TDA-C01 Practice Questions
Try 10 free TDA-C01 exam-style questions for Tableau TDA-C01 certification exam. Check each answer and review the explanation and source references.
- Exam code
- TDA-C01
- Provider
- Tableau
- Free questions
- 10
- Full set
- 117 questions
- Last update check
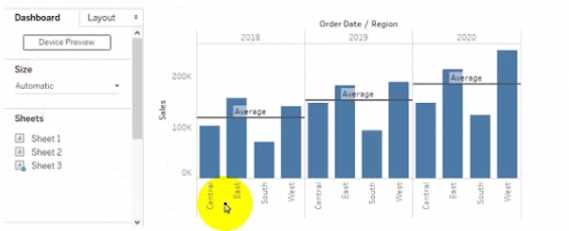
You have the following tiled dashboard that has one sheet.
 You want to replace fit sheet with Sheet2.
What should you do?
You want to replace fit sheet with Sheet2.
What should you do?
 You want to replace fit sheet with Sheet2.
What should you do?
You want to replace fit sheet with Sheet2.
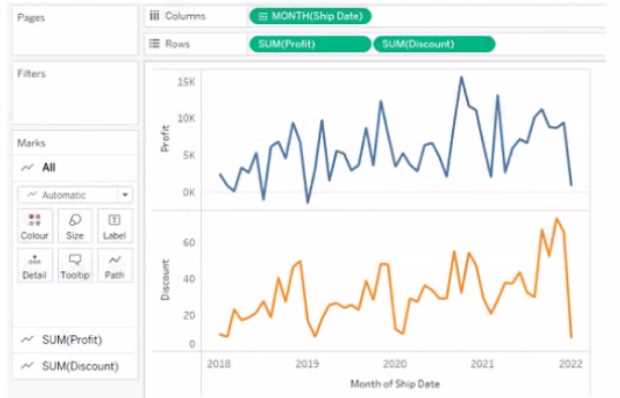
What should you do?You have the following chart that shows profits and discounts over time.
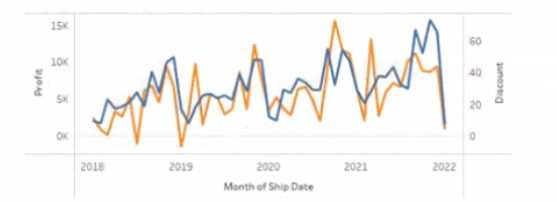
You need to combine the lines to appear as shown in the following chart.
What should you do?
 You need to combine the lines to appear as shown in the following chart.
 What should you do?
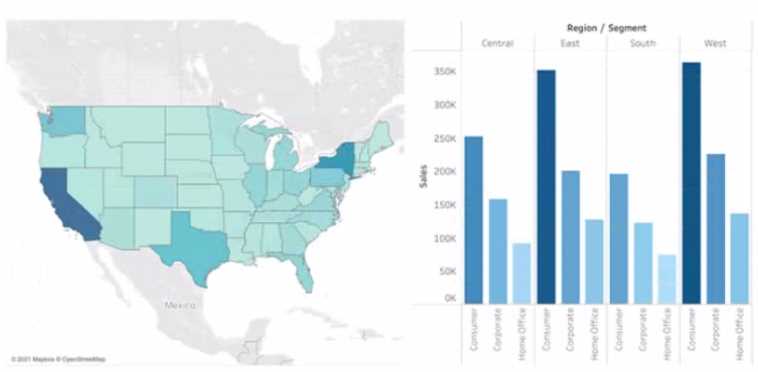
You have the following dashboard that contains two visualizations.
You want to show only visualization at time. Users must be able to switch between visualizations.
What should you me?
 You want to show only visualization at time. Users must be able to switch between visualizations.
What should you me?
You want to show only visualization at time. Users must be able to switch between visualizations.
What should you me?You have two tables named Employeelnfo and DepartmentInfo. Employeelnfo contains four fields
named Full Name, Department ID, Start Date, and Salary.
DepartmentInfo contains four fields named Department Name, Size, Department ID, and VP.
You want to combine the tables to meet the following requirements:
. Each record in Employeelnfo must be retained in the combined table.
. The records must contain the Department Name, Size, and VP fields.
· Every record must have a full name.
Which type of join should you use?
You want to create the following dashboard.
The dashboard will contain two sheets that will connect to the same data source. The top sheet will
be configured to filter the bottom sheet.
When you click a category on the top sheet, the sheets must resize as shown in the following exhibit.
How should you lay out the objects on the dashboard?
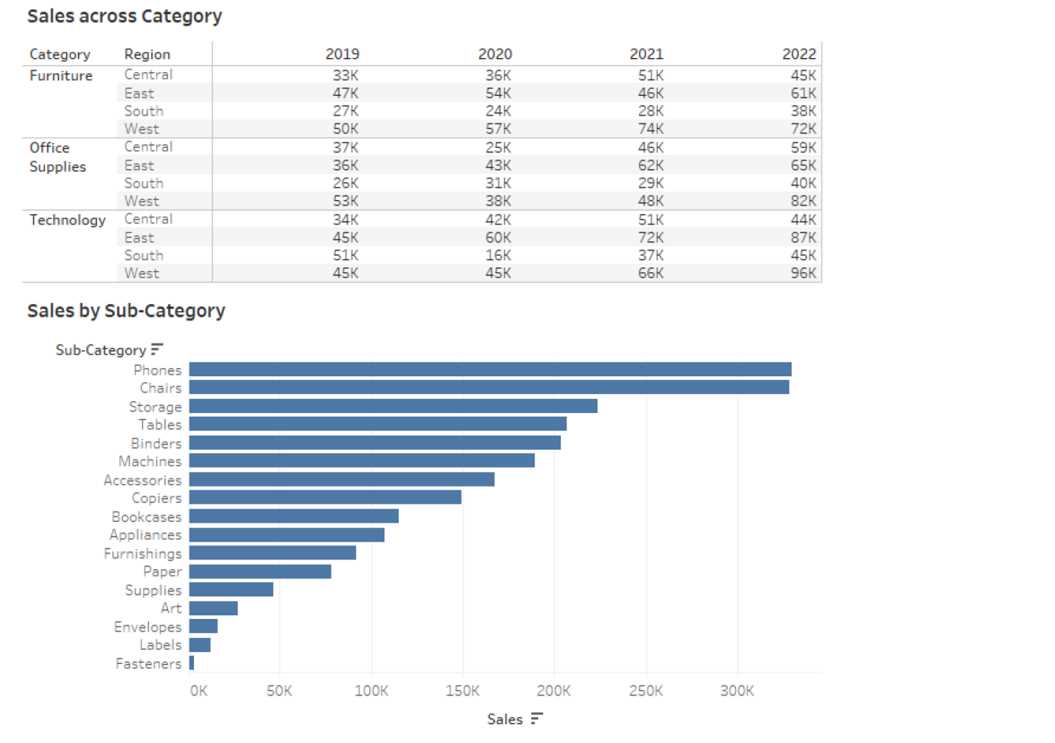 The dashboard will contain two sheets that will connect to the same data source. The top sheet will
be configured to filter the bottom sheet.
When you click a category on the top sheet, the sheets must resize as shown in the following exhibit.
The dashboard will contain two sheets that will connect to the same data source. The top sheet will
be configured to filter the bottom sheet.
When you click a category on the top sheet, the sheets must resize as shown in the following exhibit.
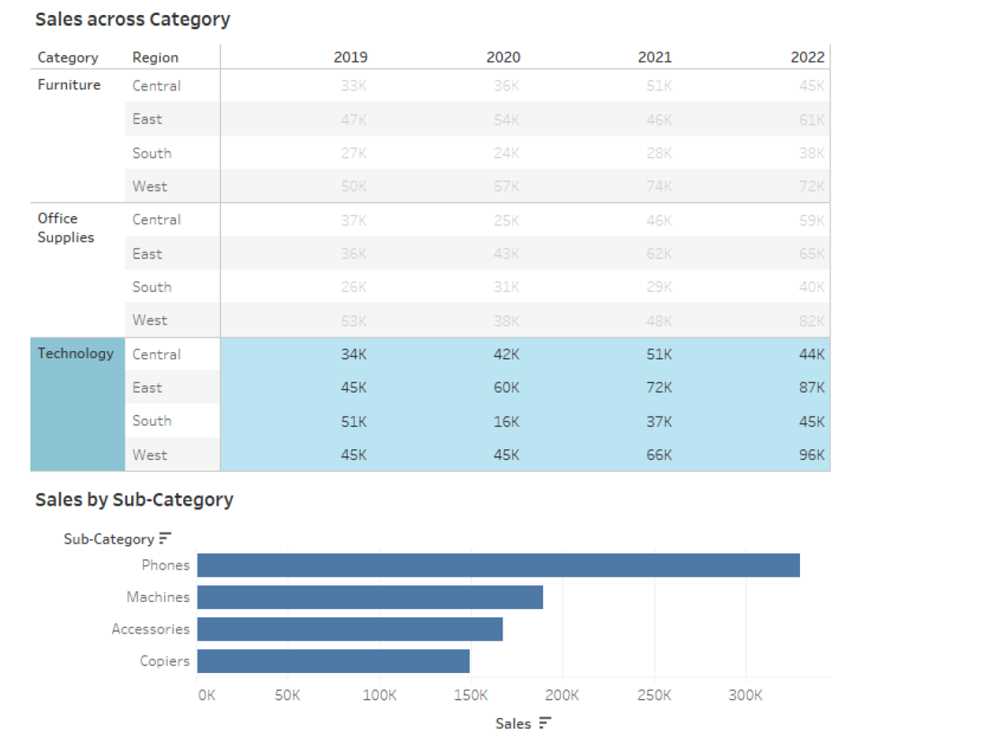 How should you lay out the objects on the dashboard?
You have a data source that contains data tor every city in the Unites States. The following is a
sample of the data.
You need to use the City dimension to create a dynamic filter that snows the cities that have a
population greater than one million Which type of filter should you use?
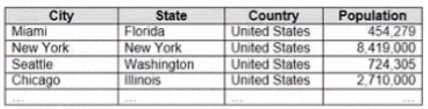 You need to use the City dimension to create a dynamic filter that snows the cities that have a
population greater than one million Which type of filter should you use?
You need to use the City dimension to create a dynamic filter that snows the cities that have a
population greater than one million Which type of filter should you use?You plan to create a visualization that has a dual axis chart. The dual axis chart will contain a shape
chart and a line chart will use the same measure named Population on the axis.
You need to configure be shapes to be much larger than the line.
What should you do?
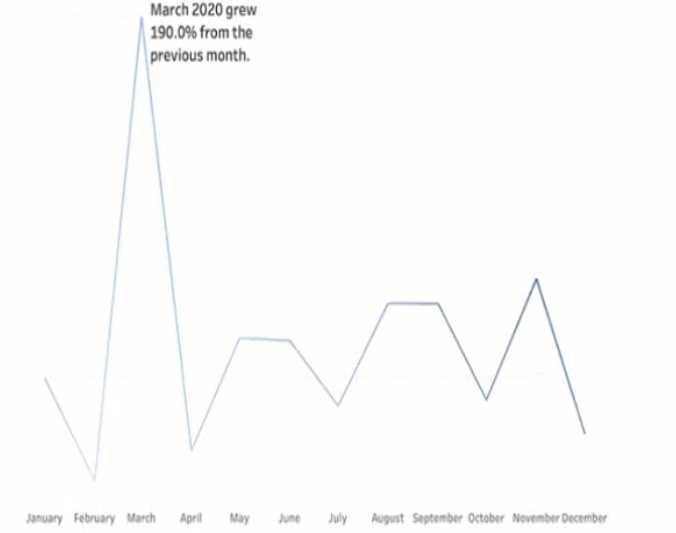
You have a line chart on a worksheet.
You want to add a comment to March 2020 as shown in the following visualization.
What should you do?
You have a data source that has two tables named Table1 and Table2. Table1 is the primary table and
Table2 is the secondary table.
You want to combine the tables by using Tableau Prep. The combined table must include only values
from Table1 that do NOT match any values in Table2. The field values from Table2 must appear as null
values.
Which type of join should you use?
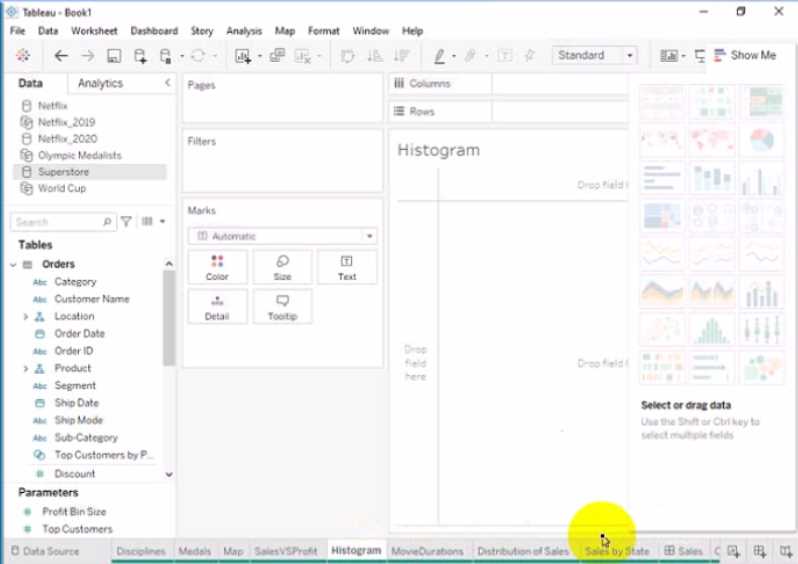
Open the link to Book1 found on the desktop. Open the Histogram worksheet and use the
Superstone data source.
Create a histogram on the Quantity field by using bin size of 3.
Question 1 of 10
Source context
How this practice set is maintained
Maintained by the CertMage content team, this page loads questions from the exam dataset connected to its preparation resource. When an answer includes a supporting reference, it is shown with that answer so you can review the underlying vendor documentation.
Certification objectives, interfaces, and vendor services can change. Verify important details against the provider's current exam guide and documentation before your exam.