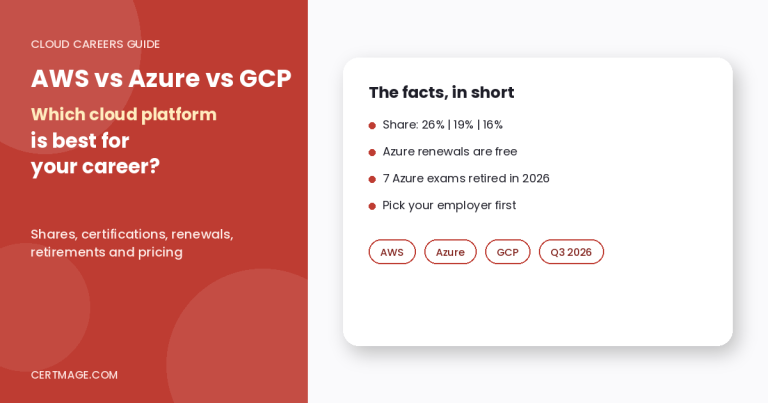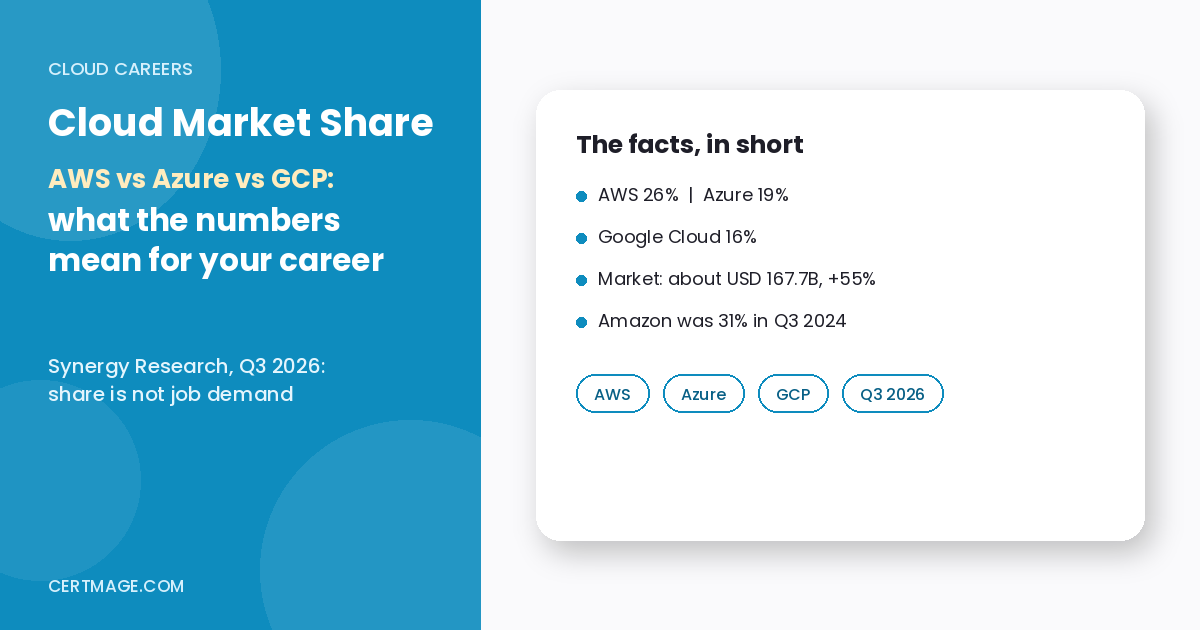
TL;DR: In the third quarter of 2026, Synergy Research estimated that Amazon held 26%, Microsoft 19% and Google 16% of worldwide cloud infrastructure services spending, in a market of about USD 167.7 billion that grew 55% year over year. Amazon is still the largest, but it has slipped from 31% in Q3 2024 and 29% in Q3 2025, while Google has risen from 13% to 16%. For a career decision, the important point is that market share and job demand are not the same thing, and every share figure depends on how the market is defined. A smaller share of a fast-growing market can still mean more jobs, so use the numbers to understand direction, then check hiring in your own location before you commit to a certification path.
Key Takeaways
- Latest Synergy figures (Q3 2026): Amazon 26%, Microsoft 19%, Google 16%, with the big three together around 61% and everyone else around 39% (our arithmetic from the rounded shares).
- Amazon’s share has fallen two years in a row, from 31% (Q3 2024) to 29% (Q3 2025) to 26% (Q3 2026), but its implied revenue kept growing because the market grew faster.
- Google is the only one of the three that gained share in the latest year, from 13% to 16%.
- Different sources give different numbers. Synergy measures cloud infrastructure services. Company earnings report their own segments, and a survey of enterprises measures adoption. They answer three different questions.
- A survey shows AWS and Azure close on adoption. Flexera’s 2026 report put active enterprise workloads at 83% for AWS and 79% for Azure, with Google Cloud described as a distant third.
- Share is not job demand. We do not have verified job-posting data for this article, so we show you how to check demand yourself.
Quick Facts
| Item | Q3 2024 | Q3 2025 | Q3 2026 |
| Market size (cloud infrastructure services) | About USD 84 billion | USD 106.9 billion | About USD 167.7 billion (estimate) |
| Year-over-year growth | 23% | 28% (excluding currency effects) | 55% |
| Amazon share | 31% | 29% | 26% |
| Microsoft share | 20% | 20% | 19% |
| Google share | 13% | 13% | 16% |
| Source | Synergy Research, Nov 1, 2024 | Synergy Research, Oct 31, 2025 | Synergy Research, Oct 29, 2026 |
Notes: Synergy defines the market as IaaS, PaaS and hosted private cloud services. The Q3 2026 total is an estimate made while most providers were still reporting. Synergy’s 2024 release also notes it restated some Azure revenue as SaaS, which lowers Microsoft’s infrastructure share, so older years are not perfectly comparable. Shares are rounded, so small differences between years may be rounding.
What Does “Market Share” Actually Measure?
It depends on who is counting, and that is why articles contradict each other. Three kinds of numbers circulate:
| Type of number | What it measures | Example | Best for |
| Analyst market share | Spending on cloud infrastructure services across the whole market | Synergy: 26% / 19% / 16% | Comparing providers on one definition |
| Company-reported revenue | What each company chooses to disclose, under its own segment definition | AWS, Azure and Google Cloud segment results | Growth and momentum, with caveats |
| Adoption survey | Share of surveyed organizations that actively use a provider | Flexera: AWS 83%, Azure 79% | Understanding how many employers use each |
If you see one article claiming Azure is “bigger than AWS” and another saying AWS is “far ahead,” they are often measuring different things. Always ask what is being counted.
What Are the Latest Market Share Numbers?
Synergy’s Q3 2026 release says worldwide cloud infrastructure services revenue reached an estimated USD 167.7 billion, up 55% year over year, with trailing twelve-month revenue of USD 558 billion. Shares were:
| Provider | Share (Q3 2026) | Change vs Q3 2025 | Change vs Q3 2024 |
| Amazon | 26% | Down 3 points | Down 5 points |
| Microsoft | 19% | Down 1 point | Down 1 point |
| 16% | Up 3 points | Up 3 points |
Synergy says Microsoft and Google “continue to achieve substantially higher growth rates” than Amazon but does not give individual growth figures in the release we read.
One arithmetic note, ours: Synergy’s own Q3 2025 figure of USD 106.9 billion and the Q3 2026 estimate of USD 167.7 billion imply growth of about 57%, not 55%. Synergy does not explain the difference in the release, and currency treatment may be involved. We use its stated 55%.
Is Amazon Losing Ground or Still Growing?
Both are true, and that is the key to reading share charts. Because the whole market grew so fast, a falling share can still mean more revenue. Here is a rough implied revenue for each provider, calculated by us from Synergy’s rounded shares and market totals (treat each figure as approximate, within about half a share point):
| Provider | Implied Q3 2024 | Implied Q3 2025 | Implied Q3 2026 |
| Amazon | About USD 26 billion | About USD 31 billion | About USD 44 billion |
| Microsoft | About USD 17 billion | About USD 21 billion | About USD 32 billion |
| About USD 11 billion | About USD 14 billion | About USD 27 billion |
In other words, all three roughly grew their infrastructure revenue every year. Google’s implied revenue about doubled between Q3 2025 and Q3 2026, in line with the share jump. This is our calculation and is not a figure any provider reported.
Why Do Company Earnings Look Different?
Company results use different definitions, so they do not match Synergy’s shares. Summaries of the Q3 2026 earnings reports give:
| Provider | Reported figure (third-party summary) | Caveat |
| AWS | About USD 46.0 billion, up 39.3% | Amazon reports on a calendar quarter |
| Microsoft Azure | About USD 33.2 billion, up 48% | Reported on Microsoft’s fiscal calendar (fiscal Q1 2027), and we could not confirm the exact disclosure in Microsoft’s filing |
| Google Cloud | About USD 30.7 billion, up 103% | The Google Cloud segment includes more than infrastructure, such as Workspace, so it is not directly comparable |
These figures come from news summaries, not the filings themselves, so confirm them in each company’s earnings release before quoting them. The lesson is that company segments blend infrastructure with software and other services, while Synergy tries to isolate infrastructure. Neither is wrong, but you cannot mix them in one chart.
What Does the Adoption Survey Say?
Flexera’s 2026 State of the Cloud report, published March 18, 2026 from a survey of more than 750 cloud decision-makers and users, found:
- AWS: active enterprise workloads at 83%.
- Azure: 79%.
- Google Cloud: described as a “distant third,” with no percentage in the release we read.
- Hybrid: 73% of organizations operate hybrid environments.
- Wasted cloud spend: 29%, the first increase in five years, according to the release.
For a job seeker, this is the more useful number. Many organizations use more than one cloud, so “adoption” overlaps and the percentages do not add to 100%. It tells you that both AWS and Azure skills are widely used inside enterprises, even though Amazon leads on spending share.
What Do the Numbers Mean for Your Career?
Share tells you where the money is going. It does not tell you how many people each employer is hiring, or what they want. Use it as one input.
| Reading of the data | What it suggests | What it does not tell you |
| Amazon leads on spending and adoption | A large base of AWS environments, so many teams use AWS skills | How many openings exist in your city |
| Microsoft is second and strong in adoption | Many enterprises that already use Microsoft products run Azure | Whether your target employers are Microsoft-heavy |
| Google is smallest but gaining | A fast-growing platform with a smaller base today | Whether smaller means fewer jobs, or just fewer competing candidates |
Our inference, not a measured result: a smaller share can mean fewer open roles overall, but it can also mean less competition for the roles that exist. The only way to know is to look at hiring where you plan to work.
How Can You Check Demand Yourself?
- List three employers you would like to work for and note which cloud each uses (job posts, engineering blogs and partner pages usually say).
- Search job boards for the certification names (for example the vendor’s associate-level name) in your city or remote filter, and count results for each cloud.
- Read ten postings per cloud and note whether the cloud is required or listed as one of several options.
- Check training and partner ecosystems if you plan to consult, since partners often specialize in one cloud.
- Repeat in three months. Hiring data changes faster than annual reports.
This takes an hour and tells you more than any share chart.
Which Cloud Should You Learn First?
| Your situation | Likely first choice | Reason |
| Your employer already uses a cloud | That cloud | Hands-on work beats any statistic |
| You are targeting large enterprises | AWS or Azure | Both show high adoption in the survey |
| You work in a Microsoft-centered organization | Azure | It fits existing tools and identity systems |
| You are interested in data and AI work | Google Cloud is worth a look | It is growing quickly, but verify local demand |
| You are undecided | Take one entry exam, then reassess | See our GCP vs AWS certification guide |
For the full three-way view of costs, exams and career fit, read our AWS vs Azure vs GCP comparison. For what each platform charges, see our Google Cloud vs AWS pricing guide.
What Should You Study After You Choose?
These are our planning ideas, not official guidance.
- If you pick AWS: start with the foundational exam, then the associate that matches your role. See our AWS Solutions Architect worth-it analysis.
- If you pick Azure: begin with the fundamentals and plan your path with our Azure certification cost guide.
- If you pick Google Cloud: read whether a Google certification is worth the money before you commit.
- If you want a broader plan: use our cloud certification roadmap, our list of top cloud and IT certifications and our guide to acing Azure and cloud certifications.
What Are Common Mistakes When Reading Market Share?
- Mixing sources. A company’s cloud segment and an analyst’s infrastructure share are different measures.
- Treating share as job count. A larger share does not guarantee more openings for beginners.
- Ignoring growth in dollars. A falling share can still be rising revenue.
- Quoting old articles. Many pages still show 2023 or 2024 figures. Check the quarter.
- Forgetting rounding. Shares are rounded, so one-point moves can be noise.
- Assuming one cloud per company. Surveys show hybrid and multi-cloud use is common.
- Skipping your local market. National or global numbers may not match what employers near you want.
FAQS
What is the AWS vs Azure vs GCP market share in 2026?
Synergy Research estimated Q3 2026 shares of 26% for Amazon, 19% for Microsoft and 16% for Google.
How big is the cloud market?
Synergy estimated about USD 167.7 billion in quarterly cloud infrastructure services revenue for Q3 2026, with trailing twelve-month revenue of USD 558 billion.
How fast is the market growing?
Synergy reports 55% year-over-year growth for Q3 2026. Its Q3 2025 growth was 28% and Q3 2024 growth was 23%.
Is AWS still number one?
Yes by share and by Flexera’s adoption survey, but its share has fallen from 31% to 26% over two years.
Is Azure bigger than AWS?
Not in Synergy’s infrastructure share. Some company-reported segments and surveys give different pictures because they measure different things.
How much of the market does GCP hold?
Synergy puts Google at 16% for Q3 2026, up from 13% a year earlier.
What is the GCP vs AWS market share gap?
Ten points in Q3 2026 (26% versus 16%), down from eighteen points two years earlier (31% versus 13%), by our arithmetic from Synergy’s rounded shares.
Why do market share numbers differ between articles?
Different definitions (infrastructure only or whole segments), different quarters and different sources. Check the date and the definition every time.
Does market share affect which certification I should take?
It can influence your choice, but employer demand in your area and your current work matter more.
Which cloud has the most jobs?
We do not have verified job-posting data. Use the checklist above to count openings in your location.
Is Google Cloud worth learning if its share is smaller?
It can be, especially if you work with data or AI, but verify local demand first.
Where do these numbers come from?
Synergy Research for market share, Flexera for adoption, and third-party summaries of company earnings. Check the sources before quoting.
Will these numbers change soon?
Yes. Synergy updates quarterly, so recheck before you rely on any figure.
Final Thoughts
Amazon still leads cloud infrastructure, Microsoft holds a strong second place, and Google is the fastest-moving of the three. The more useful lesson is that the headline numbers answer a business question, not a career question. Pick the cloud your target employers use, take one entry certification to confirm the fit, and recheck the data each quarter. Start from Synergy’s latest release if you want to read the source yourself.